Daily stock price prediction of NIFTY index and various campanies listed in NSE.
Date:
- Project description:
Processed past 10 years financial data from Yahoo Finance to extract technical indicator features such as RSI, MASI, and EMA. This project focuses on predicting stock price trend for a company in near future.
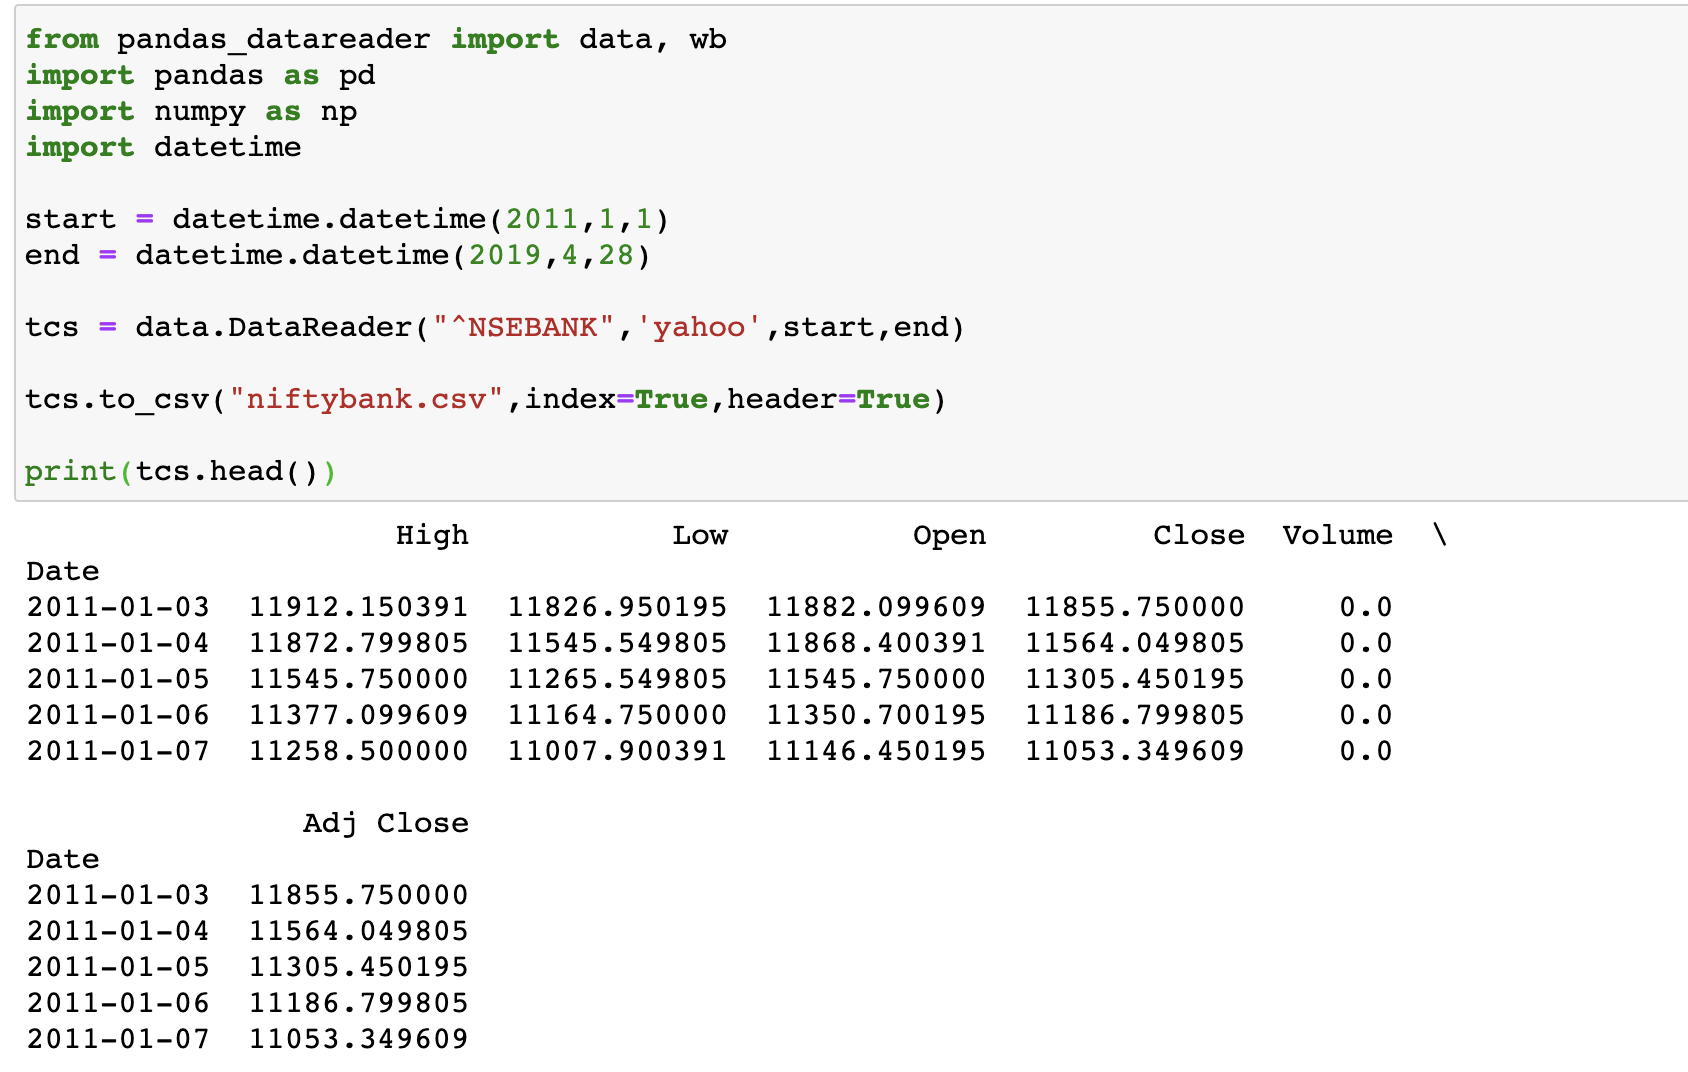
The prepared dataset looks like the figure shown below .

- Proposed Methods:
- Linear Regression
- Regression using SVM
- ANN Regression
Created Indictor functions:
Technical indicators use statistical properties of the present and previous samples, so it can be considered as more related feature as it becomes easy to uptrend and downtrend.
Technical indicators used:
- Relative Strength Index (RSI)
- Measures speed and change of price movements.
- RSI = 100 – [100 / ( 1 + (Average of Upward Price Change / Average of Downward Price Change))]
- Generally, oscillates between 0 and 100, we consider overbrought above 70 and oversold below 30.
- Money Flow Index (MFI)
- Related to RSI but incorporates volume too where RSI considers prices only.
- Typical Price = (High + Low + Close)/3
- Money Flow (not the Money Flow Index) is calculated by multiplying the period’s Typical Price by the volume.
- Money Flow = Typical Price * Volume
- If today’s Typical Price is greater than yesterday’s typical Price,it is considered Positive Money Flow.
- If today’s price is less, it is considered Negative Money Flow.
- Money Ratio = Positive Money Flow / Negative Money Flow.
- Exponential Moving average (EMI)
- SMA = avg of price data, EMA = more weight to data which is more current.
- EMA is more sensitive to price movement and used to determine trend direction
- EMA = (K x (C - P)) + P
where, C = Current Price
P = Previous periods EMA (A SMA is used for the first periods calculations)
K = Exponential smoothing constant.
- Stochastic Oscillator (SO)
- Shows the location of the close relative to high-low range over a set number of periods.
- The default setting is 14 periods, which can be days,weeks,months or an intraday timeframe.
- K=100[(C-L5close)➗(H5-L5)]
C=the most recent closing price
L5=the low of the five previous trading sessions
H5=the highest price traded during the same five-day pe
- Jupyter Notebook for Technical indicators calculations
- Relative Strength Index (RSI)
- Evaluated extensive comparisons among the metrics MSE, MAE, and percentage error.
- Implemented different models such as linear regression, support vector regression and ANN.
- Support Vector Machine

- Artificial Neural Network

- Support Vector Machine
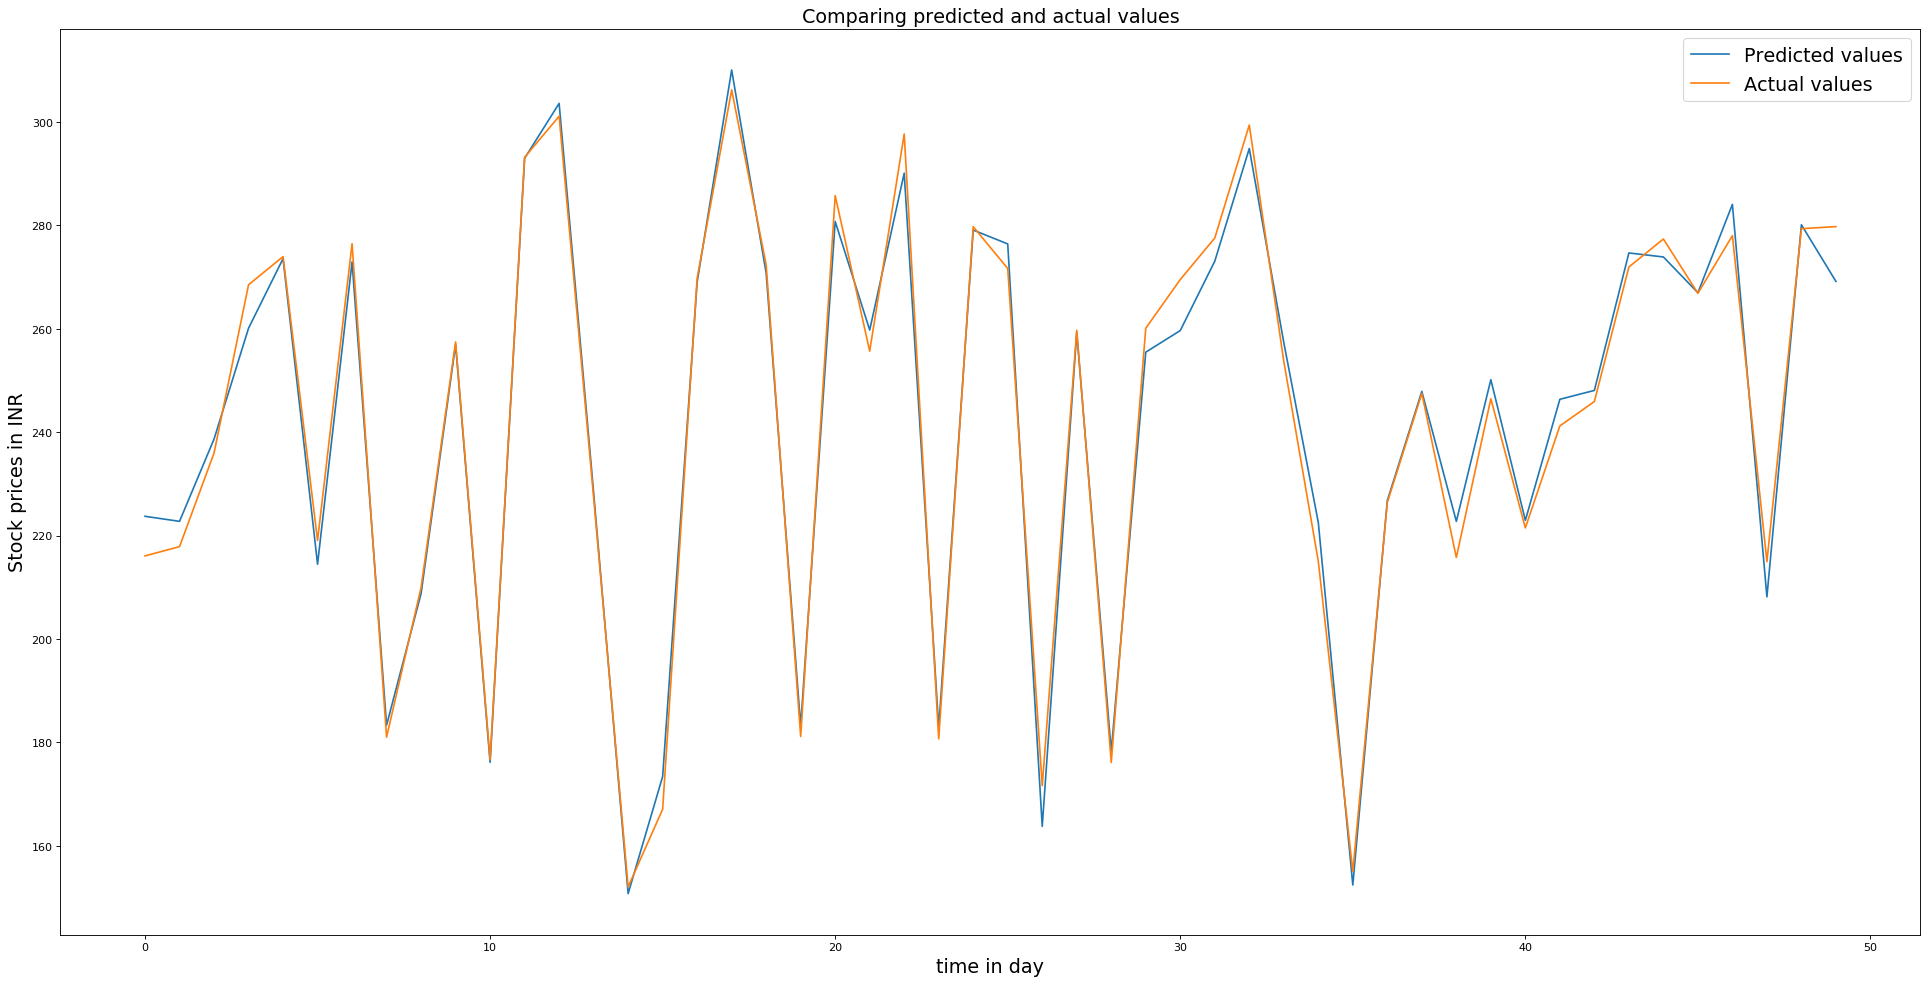
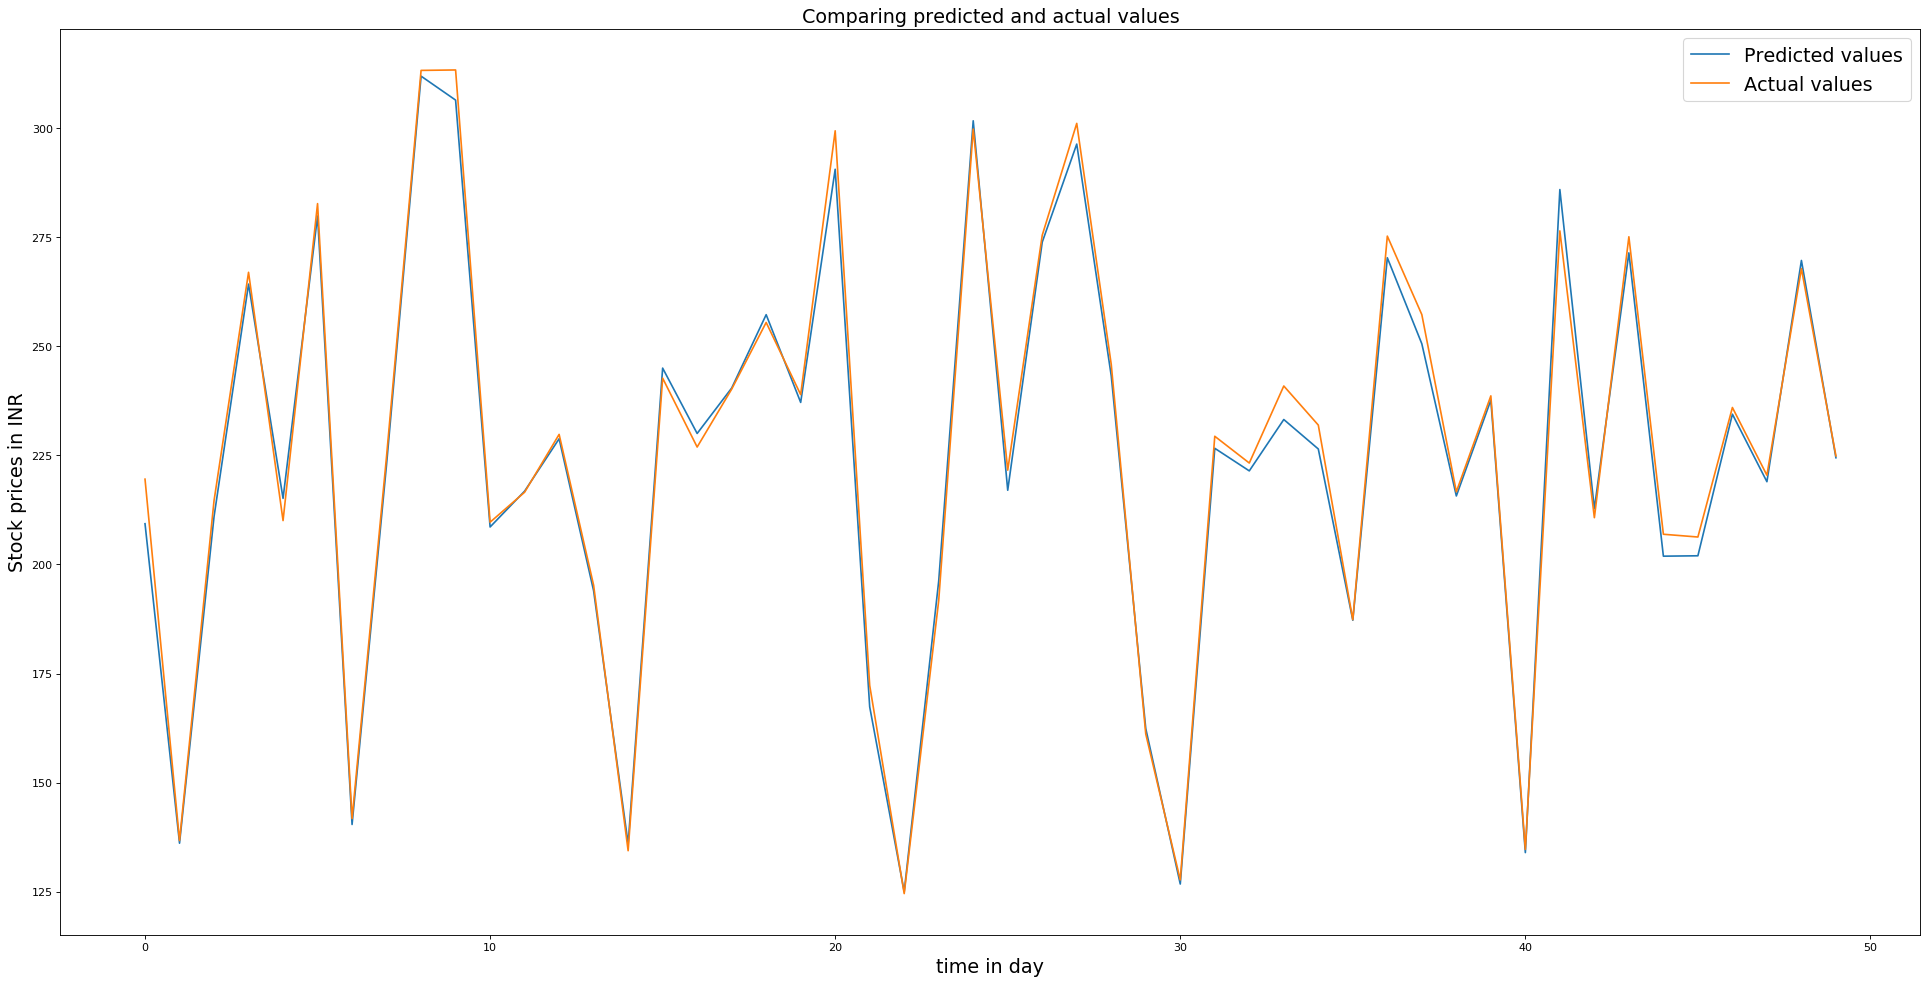
- Achieved error rate as low as 0.64% using support vector regression in NIFTY index prediction.
The resources for the Project are here.
